Google Analytics can be a little confusing for those who are new to it (especially with the recent shift to GA4), but the quantitative data it holds—and the insights that data can provide—make it a powerful marketing tool when used correctly. Unfortunately, its most helpful features often go unnoticed because they take some additional setup time. Fear not, though—we're about to walk you through three essential Google Analytics features you can set up before the end of your work day.
Demographics
When we compile data-driven insights for our clients, a crucial part of that data compilation is demographics research. Google Analytics supports that bit of research with data about the ages and genders of website visitors. If you don't think that information is crucial, think again—in the case of more than one project, those simple insights completely shifted the narrative of how a client partner interacted with its digital audience.
How to Enable It
In the left-hand sidebar of your Google Analytics dashboard, click Audience > Demographics > Overview. From there, you'll be prompted to activate demographic reporting data. Keep in mind that enabling this information won't pull in data retroactively, meaning you can't gain any data insights from before you enabled demographics data. Everything you collect will be data from that date forward.
How to Wield It
While the demographics data of your website visitors can be extremely helpful in adjusting design and content, it's important to bear statistical accuracy in mind when reviewing it. Google Analytics typically only provides a sampling of demographics data from your true-blue user base, which means it could only be showing the demographics of a handful of visitors. If that's the case, you won't want to make decisions based on that data because it could steer you in the wrong direction.
For the most statistical accuracy, base your demographics data on the largest date range you can (if you've just enabled your demographics data, it's best to let it run for a few months). Next, to determine statistical accuracy, you'll need to get a pretty good inkling of how many site visitors are in your demographics sampling. This next part requires a little bit of math, so bear with me.

Time to do some math.
Take a look at the screenshot below, which shows a hunk of demographics data based on a time frame of January 1 through February 28—about two months' worth of site visitors.
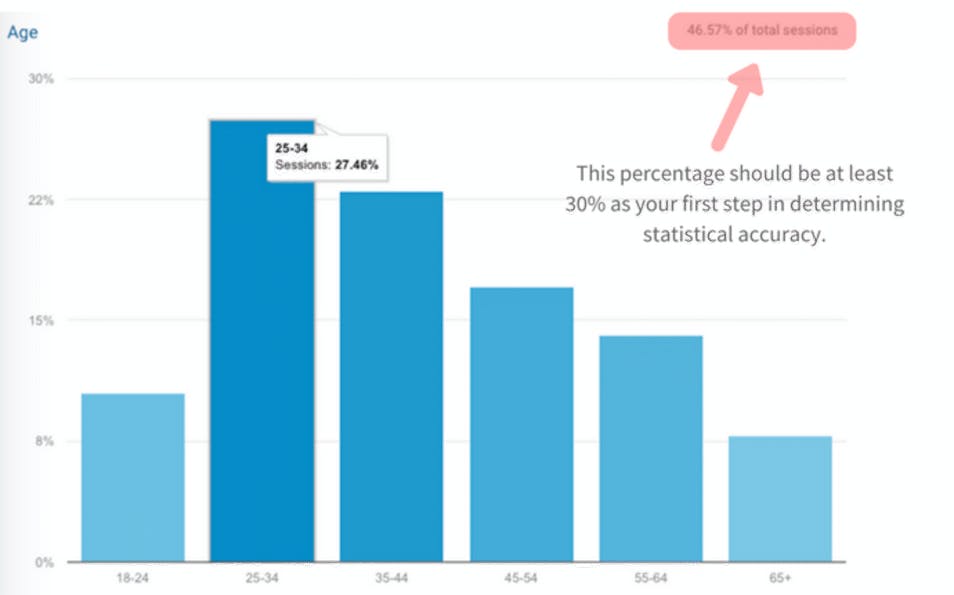
The age sampling on the left represents 46% of total visitor sessions, as you can see (our bare minimum standards for statistical accuracy lands somewhere between 30 to 40%, so we're golden here). Since the site had 116,000 total visitor sessions from January 1 through February 28, this data is representative of about 53,360 sessions (116,000 x 0.46)—and thus is safely statistically accurate. Hooray! The resulting insights—particularly that Millennials are the primary age group visiting the site—are all the more delicious because we know they're based on a very, very large visitor pool.
Benchmarking
Benchmarking is an extremely handy tool in Google Analytics because it pits your website traffic acquisition efforts against the efforts of your peers—and, in some cases, competitors. For instance, if you're putting effort towards sending more visitors to your website through social media but aren't sure how to gauge a success rate for that traffic in terms of number of visitors, how long they stay, and how many pages they visit, being ahead of all your peers—or, well, behind all your peers—can help establish ROI.
Similarly, if you're curious about whether email marketing is a marketing avenue worth exploring, benchmarking can tell you the average success rates your peers have with email marketing in terms of web traffic. If your peers only got an average of a few hundred visitor sessions out of email marketing in the past few months, you can interpret that data is being either an opportunity for you to budge in to the market—or a sign that it's not a worthwhile venture.
How to Enable It
In the left-hand sidebar of your Google Analytics dashboard, click Audience > Benchmarking > Channels. From there, you should be prompted to enable benchmarking data for your website.
How to Wield It
Just like with demographics data in Google Analytics, benchmarking data is only as helpful as its accuracy. That's why it's crucial you choose your benchmarking Industry Vertical very carefully. Take a look at the example below, which shows the benchmarking parameters set for a client partner that sells diesel engine parts online:
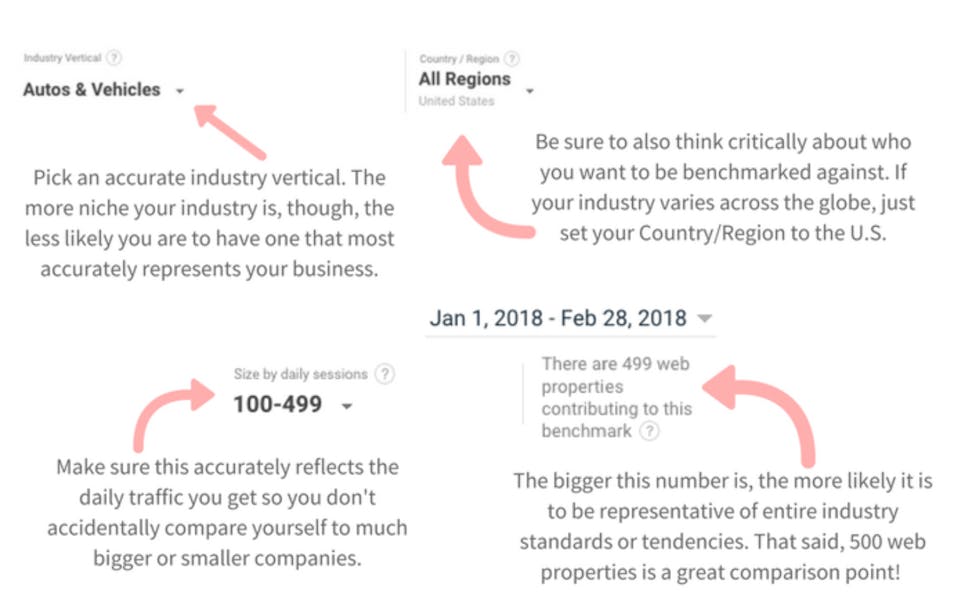
For this client partner, the above benchmarking parameters resulted in a large enough data sample, which ensures the resulting information is actually helpful.
Once you've set up your benchmarking parameters, the resulting information will likely be a Christmas-y table of green blocks and red blocks that indicate which categories you're ahead of industry standards in and which you're behind industry standards in, respectively.
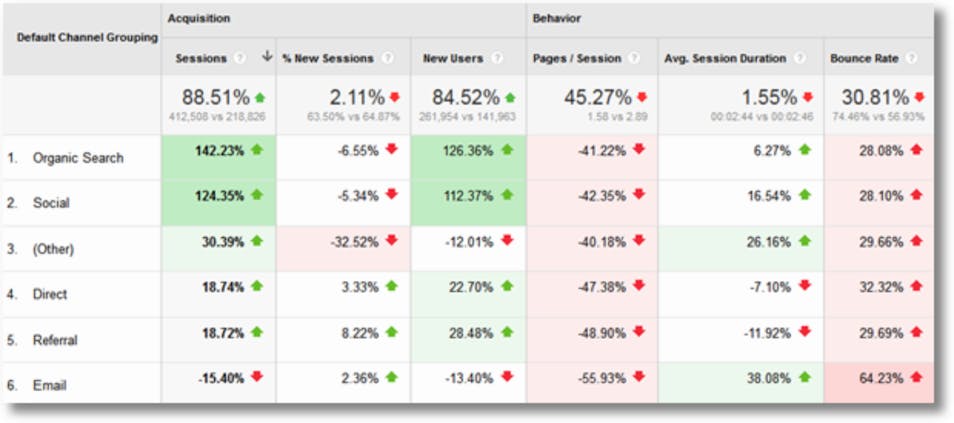
It's beginning to look a lot like Christmas / in eeeevery table it shows... Anyway. This particular screenshot is just a standard example from Google Analytics, by the way—not client data.
Don't let the resulting information overwhelm you—it's actually quite easy to interpret once you isolate a few of the variables. Start with Organic Search (traffic from Google, Bing, and Yahoo). Let's say your very first box in the top left-hand corner is green. In a nutshell, that means you're ahead of your peers when it comes to getting traffic from Organic Search. As you move to the farther right columns in that same row, the colors of your boxes will tell you a little more about the quality of your traffic from search engines, which is just as important—if not more important—than the amount of traffic itself.
It's possible you'll see entire rows that show extremely aggressive red boxes emblazoned with -100.00%—that typically means you're not utilizing that traffic acquisition source at all, which is where determining baseline standards of success and missed opportunities can come in.
When used wisely, benchmarking data can help you formulate new digital marketing strategies and steer you back in the right direction if any parts of your traffic seem lacking or otherwise amiss.
Raw Data Filtering
Have you ever been worried that your team's recurring visits to your own website are skewing your Google Analytics results? If you don't get a lot of traffic per month, you probably should. Similarly, if your website is just as much a resource for your employee network as it is for outside visitors and you've had the urge to easily isolate that data so you can view them independently from each other, tune in— data filtering is about to become your new hero.
How to Enable It
In the left-hand sidebar of your Google Analytics dashboard, click Admin. In the right-hand column, click the View dropdown. You'll likely just see your lone wolf of a default view. Click Create new view. If your goal is to separate your company's traffic from your regular traffic, name it something nice and clear that alludes to that (we typically just name it "Master View"). Choose your Reporting Time Zone and save the new view.
You'll be bumped back to the same dashboard screen you were on before. With your brand new view enabled, click Filters—it should be the fifth option down the column. Click Add Filter. From there, plug in your parameters according to this screenshot:
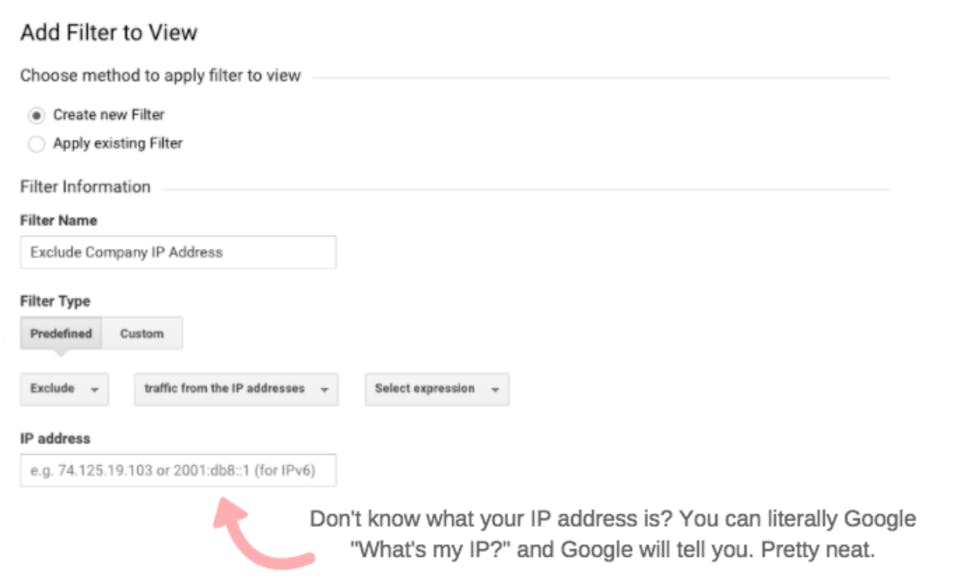
If your company utilizes more than one IP address or has several locations, enter them as separate filters.
How to Wield It
Wielding filters like this can be helpful in a lot of different ways. For one, it can help you be more confident that the Analytics data you're reviewing doesn't include your team members' repeated visits to your About page. If you have a vast network of employees who use your site as a resource, you can instead make a filter and select Include only for your company IP address(es) so you can see specifically what their habits and needs are.